August 22, 2017
By Nick Maludy of Encore Technologies
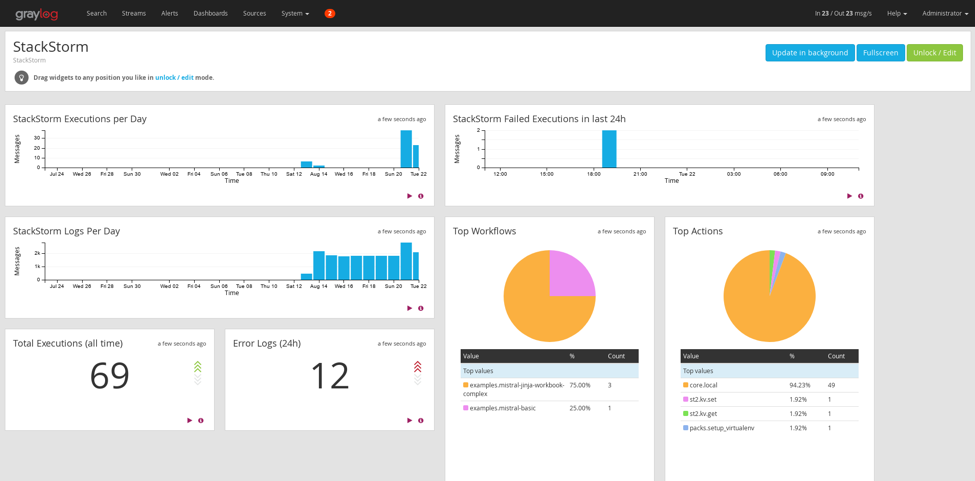
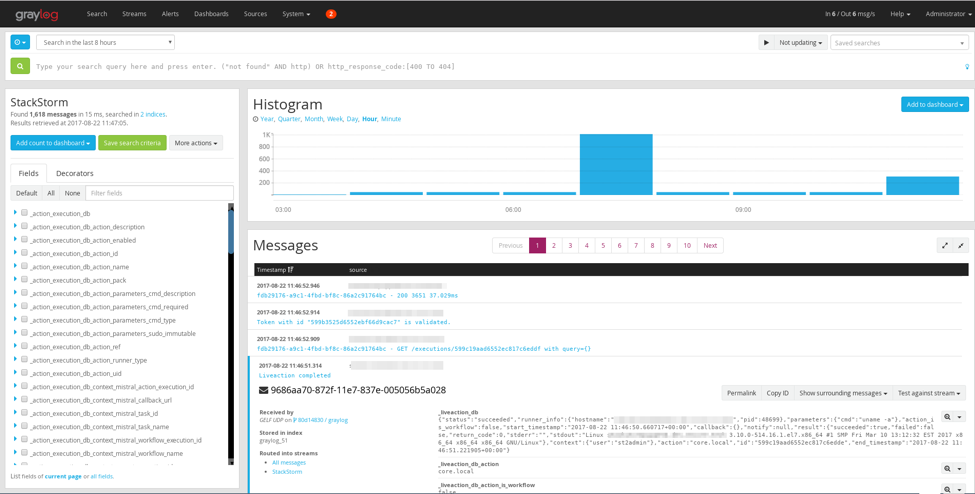
Want to implement centralized logging for your StackStorm deployment? Read on to find out how to send your StackStorm logs to Graylog, and produce pretty dashboards like this:
One of the pillars of modern application deployments is aggregating its logs in a centralized logging application such as ELK stack, Splunk or Graylog. Centralized logging allows engineers to format, index and query logs from across their stack and distributed applications and be able to access them in a single pane of glass. StackStorm is a distributed application with multiple services that can benefit greatly from centralized logging aggregation. In this blog post, we’ll investigate how to configure StackStorm to output structured logs, setup and configure Fluentd to ship these logs, and finally configure Graylog to receive, index and query the logs.
Structured logging is a fancy term for writing log output from an application in JSON format. When logs are output in JSON this gives context for all of the information contained in each log message. This context allows log shippers to save precious CPU cycles by not having to parse out this information from plain text logs. It also allows centralized logging applications to effectively index the logs and provide it with multiple fields with which to query.
To demonstrate the difference between plain text logs and structured logs we’ll take an example from st2api. Below is an example of a standard log message that is written to /var/log/st2/st2api.log:
2017-08-19 11:16:38,767 83927760 INFO mixins [-] Connected to amqp://guest:**@127.0.0.1:5672//
As you can see this has some information such as the timestamp, log level, and several other fields. If we were to try to utilize this in some meaningful way a parser would need to be written to extract the data fields. If the log message was instead written in a standard format (JSON) we could easily parse it and quickly make meaningful use of the fields within the message. Below is the structured logging message that corresponds to the plain text log from above.
{"version": "1.1", "level": 6, "timestamp": 1503174203, "_python": {"name": "kombu.mixins", "process": 76071, "module": "mixins", "funcName": "Consumer", "processName": "MainProcess", "lineno": 231, "filename": "mixins.py"}, "host": "stackstorm.domain.tld", "full_message": "Connected to amqp://guest:**@127.0.0.1:5672//", "short_message": "Connected to %s"}
This is great, but kind of hard to read. Below is the same log message formatted in a way that’s easier to read.
{
  "version": "1.1",
  "level": 6,
  "timestamp": 1503174203,
  "_python": {
    "name": "kombu.mixins",
    "process": 76071,
    "module": "mixins",
    "funcName": "Consumer",
    "processName": "MainProcess",
    "lineno": 231,
    "filename": "mixins.py"
  },
  "host": "stackstorm.domain.tld",
  "full_message": "Connected to amqp://guest:**@127.0.0.1:5672//",
  "short_message": "Connected to %s"
}
This output is in GELF (Graylog Extended Logging Format) JSON format. GELF log messages are nothing more than JSON with a few standard fields in the payload. The GELF payload specification can be found here. GELF also defines two wire protocol formats, GELF UDP and GELF TCP that detail how GELF JSON log messages can be sent to Graylog.
A log shipper is an application that reads in log messages from some source, usually a log file, potentially transforms the message and then transmits it to some destination, usually a log aggregation or centralized logging application. There are several commonly used log shippers out there including Fluentd, Logstash, and Filebeat.
In this article we’re going to be using Fluentd because it was the easiest one to configure for parsing GELF JSON and shipping to Graylog.
The setup detailed in this blog post will adhere to the following architecture:
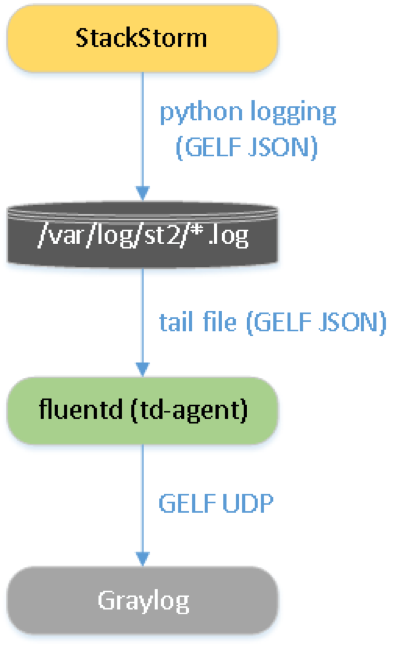
First, StackStorm uses the Python logging module to write logs to /var/log/st2/*.log in GELF JSON format. The log shipper Fluentd monitors those log files for changes, reads in any new messages, converts them into GELF UDP format and sends that to Graylog. Finally, Graylog receives GELF UDP and indexes the log messages.
StackStorm uses Python’s builtin logging module for application level logging. In this module there are two key concepts: formatters and handlers.
A formatter takes a log function call in python code and translates that into a string of text.
Python Logging Call
server = stackstorm.domain.tld
LOG.debug("Connecting to server %s".format(server))
Log String
2017-08-19 11:16:38,767 DEBUG [-] Connecting to server stackstorm.domain.tld
handlers take the log message strings and writes it to some destination. The builtin handlers can write to a file, syslog, UDP, TCP and more.
StackStorm logging configuration files are written in the logging module’s configuration file format. To configure StackStorm to write structured logs we’ll be editing the logging config file stored in /etc/st2/logging.<component>.conf. StackStorm ships with a formatter st2common.logging.formatters.GelfLogFormatter that emits structured logs in GELF format. Luckily StackStorm AUDIT logs utilize the GelfLogFormatter so there is a reference already defined that we can reuse. All we need to do is add another handler to each config that writes the GELF logs to a new file. We can define a new log handler by adding the following to every logging config:
# For all components except actionrunner
[handler_gelfHandler]
class=handlers.RotatingFileHandler
level=DEBUG
formatter=gelfFormatter
args=("/var/log/st2/st2<component>.gelf.log",)

# For actionrunner only (needs a different handler classs)
[handler_gelfHandler]
class=st2common.log.FormatNamedFileHandler
level=INFO
formatter=gelfFormatter
args=("/var/log/st2/st2actionrunner.{pid}.gelf.log",)
Now that we have a new handler defined we need to tell the logger about it. To accomplish this we’ll need to add gelfHandler to the following sections:
[handlers]
# add ', gelfHandler' the end of the following line
keys=consoleHandler, fileHandler, auditHandler, gelfHandler

[logger_root]
level=INFO
# add ', gelfHandler' the end of the following line
handlers=consoleHandler, fileHandler, auditHandler, gelfHandler
StackStorm should now be configured to write structured logs to /var/log/st2/st2<component>.gelf.log. In order for these changes to be realized we need to restart the StackStorm services. This can be accomplished by either restarting all StackStorm processes:
st2ctl restart
Or we can restart just the components we’ve modified
systemctl restart st2<component>
This is a good time to check /var/log/st2/st2<component>.gelf.log and make sure logs are present.
Astute readers may be asking “if the builtin logging facility provides a UDP handler, why not use it to send logs directly to Graylog?”. The answer is fairly simple, the DatagramHandler which writes log strings to UDP does NOT format the messages in GELF UDP format. GELF UDP requires a special header at the beginning of every packet. To accommodate this we’ll be using Fluentd in the next section to send the log message in GELF UDP format to Graylog.
We’re going to use Fluentd to read from /var/log/st2/st2<component>.gelf.log and transform the log messages into GELF UDP format, then send those UDP packets to Graylog.
First we need to install Fluentd v0.14.
Note Fluentd v0.14 is required if you would like sub-second resolution on your logging timestamps. In Fluentd v0.12 timestamps are rounded to 1-second resolution. This causes the messages in graylog to potentially be viewed out-of-order because Graylog doesn’t know which message came first within a 1-second interval.
Below are instructions for installation on RHEL 7, for all other platforms please follow the official documentation here.
Note Fluentd is the name of the log shipping application and it is written by a company called Treasure Data (td). The agent installed on your machine is called
td-agentand it wraps Fluentd in a service file that’s specific to your platform.
# add GPG key
rpm --import https://packages.treasuredata.com/GPG-KEY-td-agent

# add treasure data repository to yum
cat >/etc/yum.repos.d/td.repo <<'EOF'
[treasuredata]
name=TreasureData
baseurl=http://packages.treasuredata.com/3/redhat/\$releasever/\$basearch
gpgcheck=1
gpgkey=https://packages.treasuredata.com/GPG-KEY-td-agent
EOF

# update your sources
yum check-update

# install the toolbelt
yum install -y td-agent

# start service
systemctl start td-agent
systemctl enable td-agent
After installation we need to install a Fluentd plugin that implements GELF UDP output formatting.
/usr/sbin/td-agent-gem install fluent-plugin-gelf-hs
Next we need to configure Fluentd to tail the new StackStorm log files we configured in the previous section. The default location for the Fluentd config file is /etc/td-agent/td-agent.conf:
export GRAYLOG_SERVER=graylog.domain.tld
export GRAYLOG_GELF_UDP_PORT=12202
cat >> /etc/td-agent/td-agent.conf << EOF
<source>
  type tail
  format json
  path /var/log/st2/st2actionrunner*.gelf.log
  tag st2actionrunner
  pos_file /var/run/td-agent/st2actionrunner.gelf.log.pos
  enable_watch_timer false
  estimate_current_event true
</source>

<source>
  type tail
  format json
  path /var/log/st2/st2api.gelf.log
  tag st2api
  pos_file /var/run/td-agent/st2api.gelf.log.pos
  enable_watch_timer false
  estimate_current_event true
</source>

<source>
  type tail
  format json
  path /var/log/st2/st2auth.gelf.log
  tag st2auth
  pos_file /var/run/td-agent/st2auth.gelf.log.pos
  enable_watch_timer false
  estimate_current_event true
</source>

<source>
  type tail
  format json
  path /var/log/st2/st2garbagecollector.gelf.log
  tag st2garbagecollector
  pos_file /var/run/td-agent/st2garbagecollector.gelf.log.pos
  enable_watch_timer false
  estimate_current_event true
</source>

<source>
  type tail
  format json
  path /var/log/st2/st2notifier.gelf.log
  tag st2notifier
  pos_file /var/run/td-agent/st2notifier.gelf.log.pos
  enable_watch_timer false
  estimate_current_event true
</source>

<source>
  type tail
  format json
  path /var/log/st2/st2resultstracker.gelf.log
  tag st2resultstracker
  pos_file /var/run/td-agent/st2resultstracker.gelf.log.pos
  enable_watch_timer false
  estimate_current_event true
</source>

<source>
  type tail
  format json
  path /var/log/st2/st2rulesengine.gelf.log
  tag st2rulesengine
  pos_file /var/run/td-agent/st2rulesengine.gelf.log.pos
  enable_watch_timer false
  estimate_current_event true
</source>

<source>
  type tail
  format json
  path /var/log/st2/st2sensorcontainer.gelf.log
  tag st2sensorcontainer
  pos_file /var/run/td-agent/st2sensorcontainer.gelf.log.pos
  enable_watch_timer false
  estimate_current_event true
</source>

<source>
  type tail
  format json
  path /var/log/st2/st2stream.gelf.log
  tag st2stream
  pos_file /var/run/td-agent/st2stream.gelf.log.pos
  enable_watch_timer false
  estimate_current_event true
</source>

<match st2**>
  type gelf
  host $GRAYLOG_SERVER
  port $GRAYLOG_GELF_UDP_PORT
  protocol udp
  flush_interval 5s
  estimate_current_event true
</match>
EOF
Note
estimate_current_event trueis used in the config file because the timestamps emitted by StackStorm are rounded to 1-second resolutions. This is fixed in PR #3662 where a new fieldtimestamp_fis added to the GELF logging output. This PR has been merged and should be available in StackStormv2.4. In these versions you can replaceestimate_current_event truewith:time_key timestamp_f keep_time_key true
Finally we need to restart Fluentd so that the config file changes are realized:
systemctl restart td-agent
Fluentd should now be sending log messages to Graylog, however Graylog is not listening.
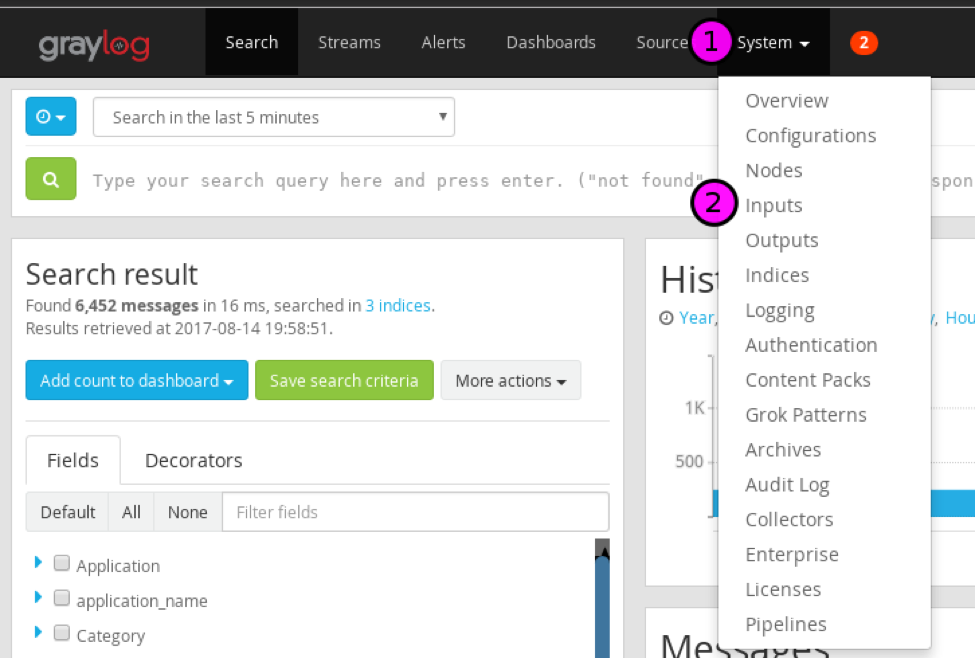
To configure Graylog to receive GELF UDP messages we need to add a new Input. In the Graylog WebUI navigate to System > Inputs:
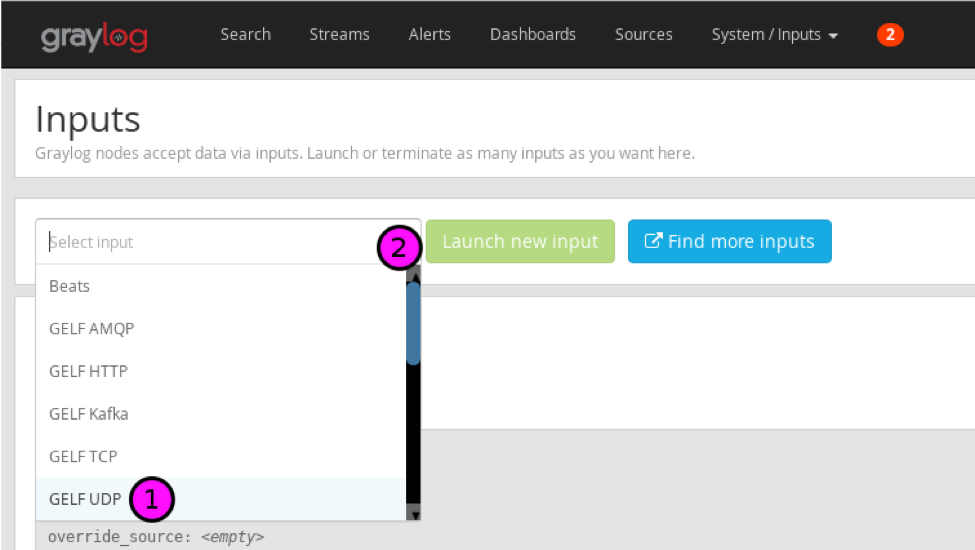
To add a new input click the dropdown Select a new input type: and select GELF UDP then press the button Launch new Input.
In the new input dialog configure it with the following settings:
Leave all other settings as defaults, and click Save.
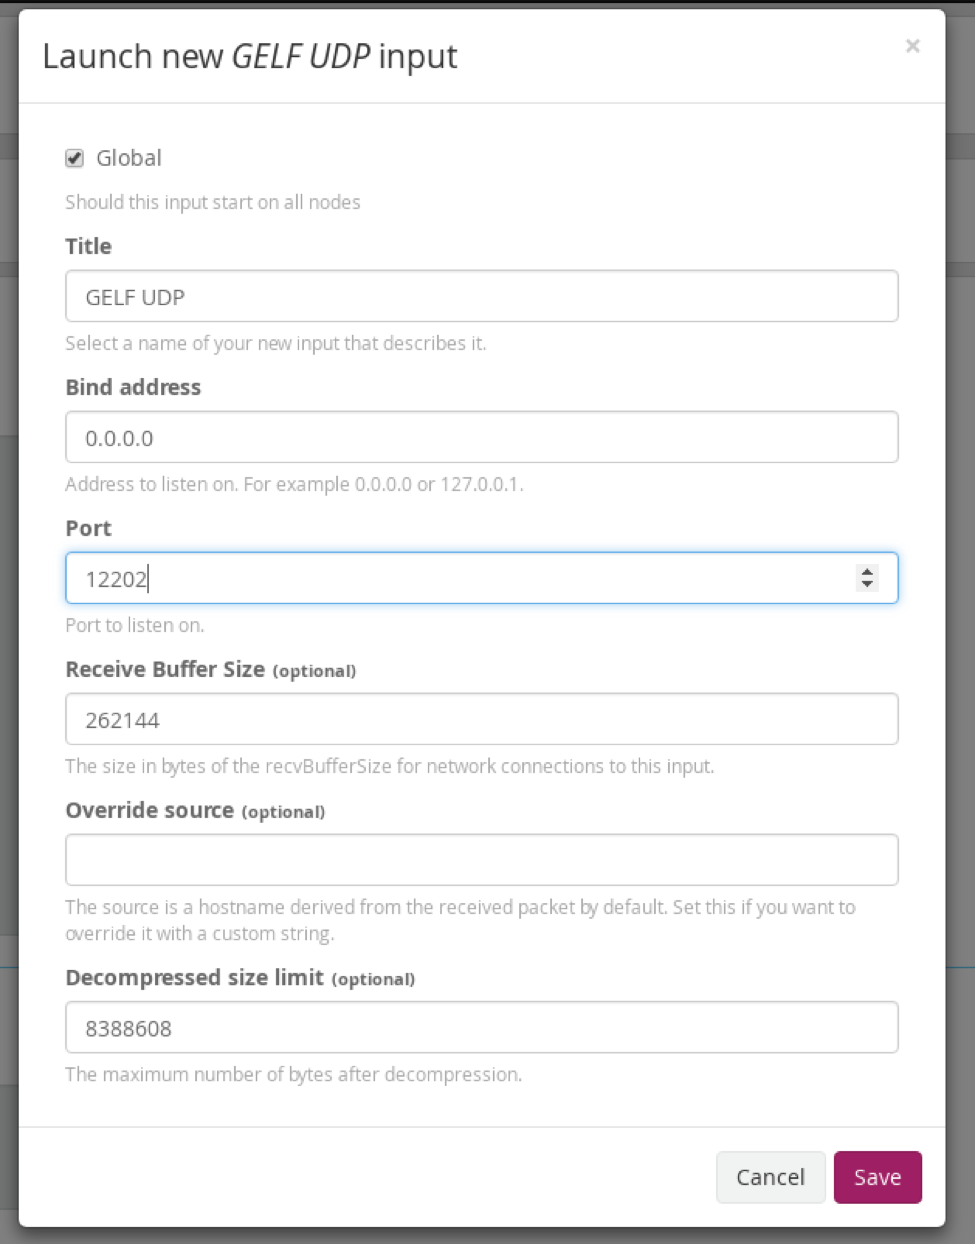
Why did we choose port 12202? Graylog, by default, logs its internal logs to udp/12201 so we need to choose a different port to differentiate the inputs. Graylog should now be receiving log messages from StackStorm.
If you’re not seeing any messages flowing in you can always run an action st2 run or restart a service systemctl restart st2api and this should force logs to be written.
We’ve introduced you to structured logging and log shippers, then walked you through the configuration and setup of utilizing these technologies to stream StackStorm logs into the centralized logging application Graylog. Now that we have StackStorm logs into Graylog, what can we do with them? In a future blog post I’ll walk you through creating a dashboard that will provide insight and visualization of your StackStorm deployment.
Nick Maludy is the DevOps Manager at Encore Technologies, a company out of Cincinnati Ohio that specializes in Datacenters, Cloud and Managed Services, Professional Services and Hardware Sales. Nick works in the Cloud and Managed Services organization that is focused on providing customers with tailored IT solutions to accelerate their business through automation and modernization.